A photography histogram is a great tool and learning to use your camera’s histogram is a great idea. However, you should know that it’s not 100% perfect all the time. So we’re looking at how to read a camera histogram and how to know when not to rely on it.
You shouldn’t rely entirely on your camera histogram
The thing is though, if you’re using it properly, you’ll know that you can’t rely on it entirely.
You need to observe the scene and make a decision too, because you know more than the histogram about what you’re photographing.

About the photography histogram
Photography histograms aren’t just for digital cameras. Many photo editing programs, like Lightroom, also have a histogram.
So it’ll help your photography to know about the histogram and it’s actually a very simple tool to read. I’ll break it down into…
- What is a photography histogram?
- Why do I need to know how to use a histogram?
- What are a histogram’s weak points? Histogram myths.
- How does a histogram work?
- Different types of camera histograms
Let’s get started…
1. What is a photography histogram?
In photography, a histogram is a graph that represents the tonal variation in an image from dark shadows to bright highlights, and everything in between.
You view a camera histogram on the back of your camera to get an indication of whether you’ve over, under or correctly exposed your image.
2. Why do I need to know how to use a camera histogram?
I find my camera histogram particularly useful when I can’t see the image in the LCD, like when I’m shooting outdoors on a really bright day. In fact, I always wonder how on earth anyone can decide if their image is correctly exposed purely by checking the back of the camera.
When processing a shoot in Lightroom, the histogram helps me to ensure that my adjustments don’t push the exposure too far, causing loss of detail. The histogram also separates the colors out, which is helpful for ensuring all colors within the image are well exposed.
However, histograms are not living beings. They don’t exercise judgement of what’s in a scene or how bright it’s meant to be. They only know how to report back the data of the scene, indicating overexposure or underexposure errors.
Which leads me to my next point.
3. What are a camera histogram’s weak points?
Histograms aren’t perfect. So you can’t rely entirely on your camera histogram to determine your image is correctly exposed. Here are three example scenarios:
- Polar bear in snow
- Black cat on a black background
- Black and white cows in a field
Quick side note: If you’re not shooting in manual mode, you’ll need to use exposure compensation to ensure accurate exposure in the first two scenarios.
Polar bear in snow
If you find yourself lucky enough to be photographing a polar bear in the Arctic, you’ll know that there’s a whole lot of white and not a lot of other colors, except for the bear’s eyes and nose.
However, your camera’s histogram doesn’t know what you’re photographing. It only sees a whole stack of white and just a smidge of black.
So, when you look at the camera histogram of your polar bear photo, you’ll see that the right side of the graph is full of information and the left is barren.
For these circumstances, this type of graph indicates an accurate exposure.
Black cat on black background
The reverse is true for a photograph of a black cat on a black background. Lots of black, with the only other color being the eyes.
In these conditions, for an accurate exposure your camera histogram will bunch up towards the left of the graph. If it’s not, then your photo isn’t accurately exposed.
Cows in a field
Let’s imagine you’re photographing:
- A herd of black and white cows
- in a green pasture
- with a lovely blue sky above
In this situation we have tonal variety – midtones in the sky and grass, contrasting black and white of the cows.
Your histogram graph will be mainly in the middle, with information spread across it. If it’s bunching towards one side or the other, your shot is under (to the left) or over (to the right) exposed.
PS: an easy exposure metering trick in this scene would be to meter off the grass as it’s medium gray, so works like a gray card. Check out my article on using the zone system for more easy exposure tips.
That’s a really simple explanation. Now let’s get into the details of how to read a camera histogram.
4. How does a photography histogram work?
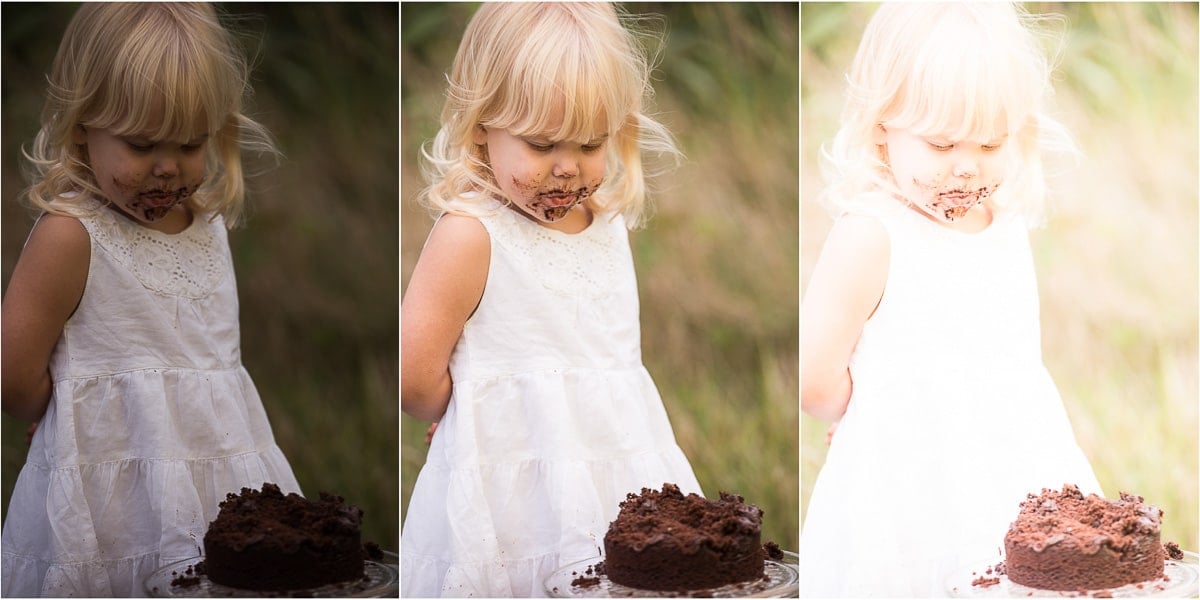
I’ve used a photo of a two year old with a serious passion for chocolate cake to demonstrate how a histogram works:
- On one end of the tonal range we have dark chocolate cake
- In the mid range we have green grass and skin tones etc
- On the other end of the tonal range is her white dress
If you’re wondering why it doesn’t look like the histogram on the back of your camera, it’s because I’ve used Lightroom histograms to demonstrate. Same principle, just more detail and I can screenshot it for you.

Photography histogram basics
Most of the time, to get an accurate exposure, you need to make sure that the graph doesn’t touch the left and right sides of the box. If this happens it means that your image is either under or over exposed, as you can see in the examples above.
When an image is underexposed we refer to the blacks as being “clipped”, and when overexposed, we say the whites have been “clipped”.
If you clip the whites all detail will be lost in that area and it will be recorded as pure white. There’s no coming back from that in post production.
When you clip the blacks you can still retrieve some of the information in that area in post production. So it’s better to underexpose than to overexpose.
This is one of the reasons why shooting in RAW is often better than JPEG.
Speaking of which, remember that the image you see on the LCD of your camera is a JPEG image.
If you shoot in RAW, which has a higher dynamic range than JPEG, more detail will be recorded than what you see in the image on your LCD.
So if there’s clipping, it might be less than it appears on your camera’s LCD.
Understanding photography histogram shapes
Don’t fall into the trap of thinking you have to have a perfectly domed hill right in the middle of the histogram.
Also, if your spike in the middle of the histogram hits the top, that’s fine. It just means there’s a lot of that particular tone in the image. Clipping only happens when the graph hits the left or right side.
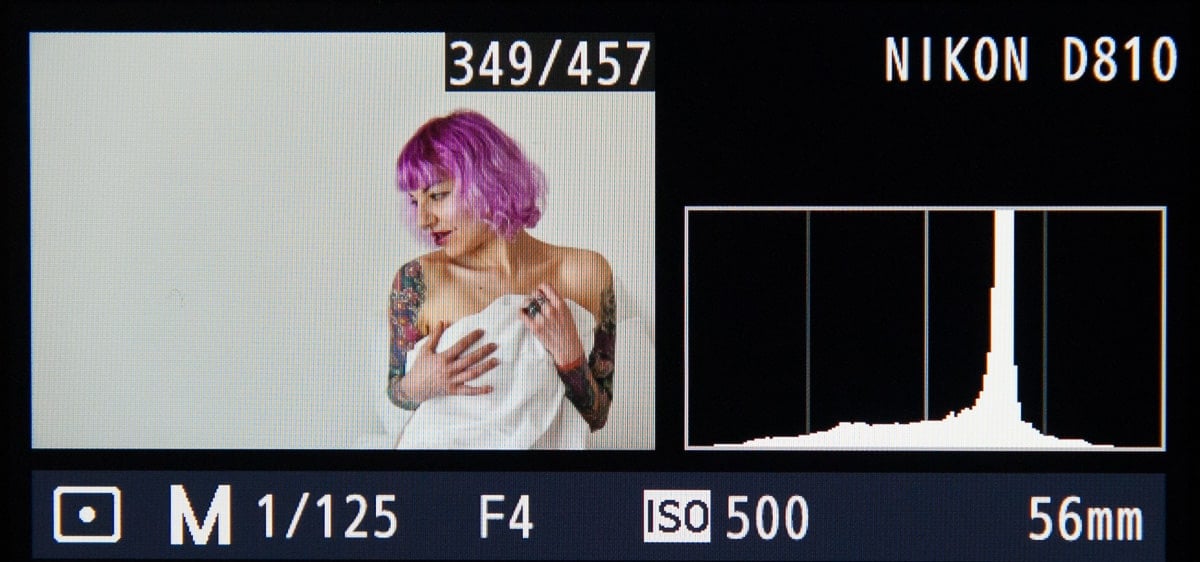
The histogram example from the back of my camera at the top of this article shows this pattern.
If you photograph a black cat on a white background, it’s a high contrast scene, because the image includes both ends of the tonal range. So your histogram will show peaks towards both ends with a dip in the middle, like a U shape.
Have you heard of exposing to the right?
Exposing To The Right (ETTR) is ideal for photographing a subject consisting of mid-tones. The contrast in the image is low, with no dark areas and no bright areas.
In this instance, to get a correctly exposed image, the histogram should read as far to the right as possible, without clipping.
Sometimes clipping is okay
There are two types of scenes that’ll show clipping in the camera histogram. In these types of scenes, it’s okay if clipping occurs to ensure either white whites or black blacks. They are:
- High key scenes – brightly lit scenes with little or no shadow, such as in a studio with a bright white background, or scenes with a lot of white, such as the polar bear example or the image in the histogram at the start of this article.
- Low key scenes – dark scenes with a lot of dramatic shadow for atmosphere.
5. Different types of camera histograms
Now that you know how a histogram works, it’s helpful to know that many digital cameras have different types of histograms.
- Luminance histogram
- RGB histogram
The good news is that, as long as you know how to read a histogram, you can understand both types of camera histograms.
Luminance histogram in photography
A luminance histogram measures the overall brightness (luminance) of the scene. So you’re probably familiar with the luminance histogram – the one at the start of this article.
It shows a white graph on a black background, or vice versa.
RGB histogram in photography
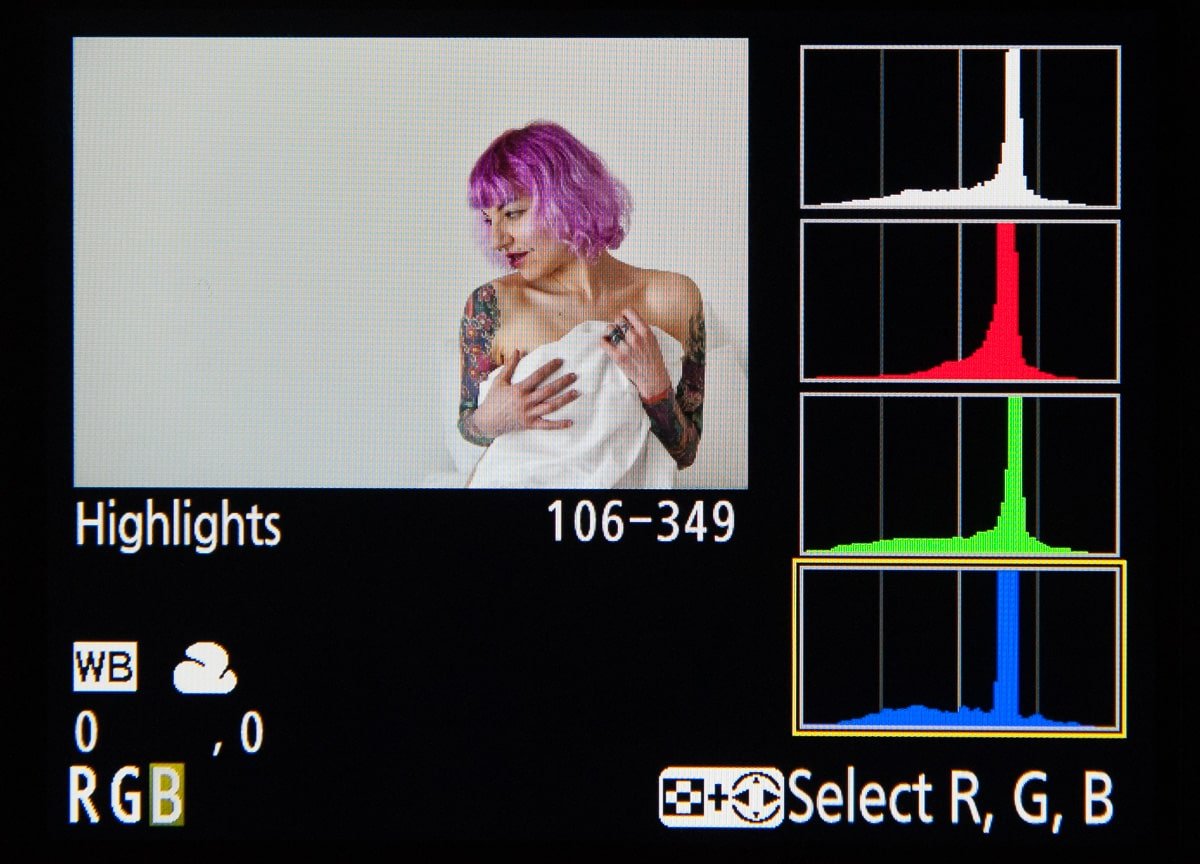
An RGB histogram is really useful for seeing if any of the red, blue or green parts of the image have been clipped.
If you have this function set on your camera, you can see separate red, blue and green graphs, like in the image below.
Conclusion on how to read a histogram
Once you know how to read a camera histogram, you’re well on your way to controlling exposure. The key word in my statement at the start of the article was “entirely” – you shouldn’t rely entirely on your camera’s histogram.
As usual with photography, it’s up to the photographer, not the camera, to make the final decision on the outcome of an image. Sometimes you just need a little guided help from your camera’s clever tools.
Leave a comment
If you have any questions about how to read a histogram, let us know in the comments.
Also, I love good news, so if my camera histogram tips have helped you to understand how a photography histogram works, share that too.
Would like to be notified for new post
Hey Damian – you can sign up to the weekly newsletter. One of the sign up forms is on the bottom of the homepage. Here’s the link – https://thelenslounge.com
Hi Jane,
Great site, always to the point writing and topics for exterior or studio/ softboxes etc.
I’ve only used Canons and received this Histogram post, with my experience using the histogram’s benefit, a lot. Although please give opinion. This may seem a little precious for general shooting and yet….
If the histogram is about accuracy and “you shouldn’t rely entirely on your camera’s histogram”, yep; what do you think?
Both companies are huge and know what they’re doing – yet the D8 10 graph as displayed, has four columns with a vertical line between the left pair and the right pair of columns.
On my current SL 2, and the older Rebel from years ago, the graph has five columns: The column in the middle of the Canon is the same as middle-line on Nikon. However, it is a column. Yes, clipping on far left or far right, is straight forward but we live in the middle most of the time unless black and white on purpose or something by design in colour, but on purpose…
The point is I enjoyed the article knowing that I’ve judged during still shooting and the zoom exposure set-up, the small but obvious and controllable changes in the movement left to right – within that center column or resulting effect to either side, on the Canon. Has Nikon always had four columns and Canon 5? Thx, Frank
Hi Frank
Thanks for your comment. To be honest, I’m not sure if Nikon has always had 4 columns and Canon 5.